Article
Measuring and Tracking the Success of Your Product-Led Growth Strategy: Key Metrics and KPIs
The ultimate guide to product-led growth metrics and KPIs. Everything you need to know, including how to choose the right metrics for your business, how to collect and analyze data, and how to use insights to improve your PLG strategy.
HC

Hamse Nur
·
Aug 19, 2023

As a startup founder or executive, adopting a Product-Led Growth strategy can be a game-changer for your business. To ensure success, you need to have a clear understanding of how to measure and track its effectiveness.
In this blog post, we will explore the key metrics and product KPIs that are crucial for evaluating the success of your PLG strategy.
What is a Product KPI?
Before we dive in you might be wondering, what is a product KPI? The ancrynoym KPI stands for key performance indicator and your products KPIs serve as a tool for decision making. Product KPIs are often tracked by product managers, but reflect every aspect of your organization. In this article we will identify which KPIs are best for tracking your product performance.

Identifying the Right Metrics & KPIs for Your PLG Strategy 🔑
Before measuring product KPIs and the success of your PLG strategy, you must start by defining clear objectives and goals. What specific outcomes do you want to achieve through PLG while users are on their journey of your product?
Your choice of metrics should also align with the different stages of the customer lifecycle. For instance, metrics related to user onboarding and activation are relevant in the early stages, while expansion metrics become more critical as your customer base grows.
Furthermore, the nature of your product also impacts the metrics you should focus on. For Software as a Service (SaaS) products, metrics such as Monthly Recurring Revenue (MRR), Churn Rate, and Customer Lifetime Value (CLV) are highly relevant, while non-SaaS products might prioritize metrics like Customer Acquisition Cost (CAC) and Average Order Value (AOV).
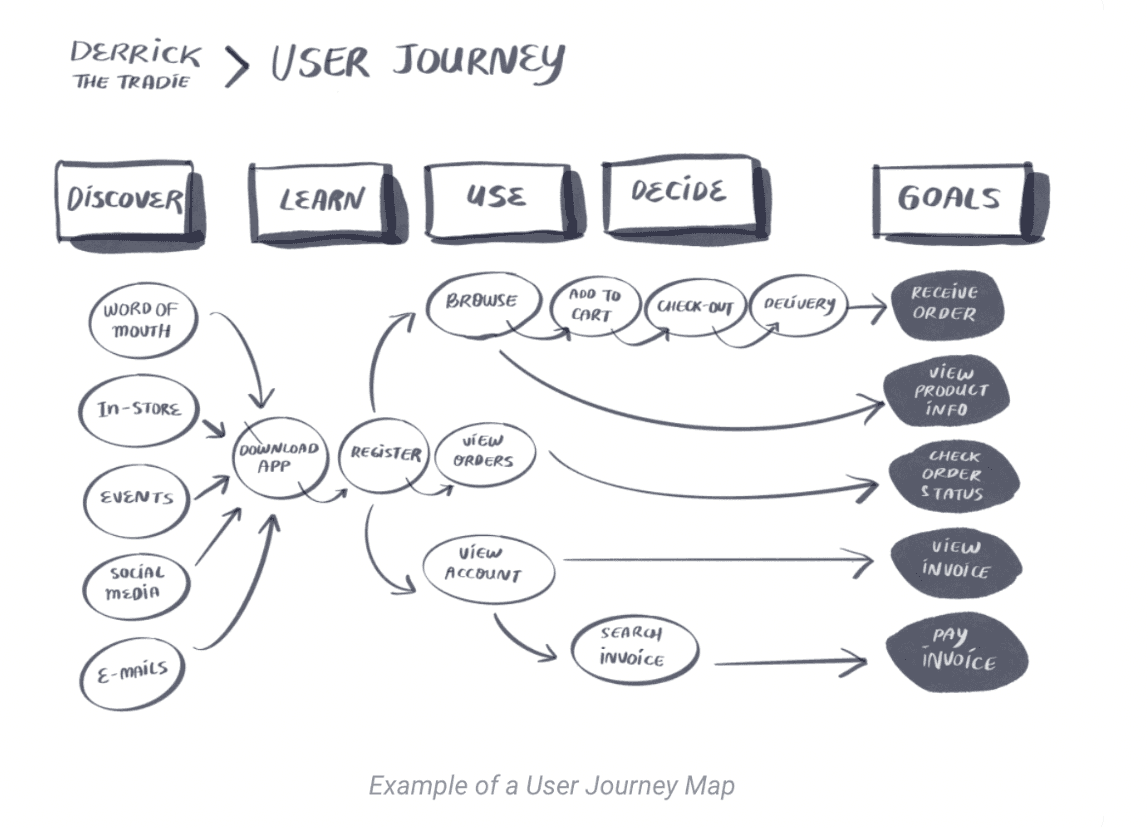
If you haven't mapped a user journey, use this map from Relab Academy as a guide!
Which product metrics should I use? 🧰📈
With so many product KPIs to track, activation, engagement and referral metrics should always stay on your radar.
What counts as an activation metric? 👾
Activation metrics track how often users engage with key activation points that indicate value. These points could be any interactions that your business considers valuable moments.
- % of users who complete the onboarding tutorial
- % of users who create an account
- % of users who complete the onboarding tutorial
- % of users who perform their first search
- % of users who make their first purchase
- % of users who sent their first message
- % of users who added a friend or connection
What are some important engagement metrics? 📲
Use engagement metrics to see how actively involved your audience is through likes, comments and social sharing.
- % of users who return within 7 days
- % of users who return within 30 days
- % of users who make a repeat purchase
- % of users who upgrade to a premium or paid plan
- % of users who refer additional friends
- % of users who invite new teammates or contacts
- % of users who extend their subscription or membership
What counts as a referral metric? 👯
Referral metrics measure clients created by leveraging your existing client ecosystem. These metrics include:
- % of users who refer a friend% of referred friends who sign up
- % of referred friends who complete their first purchase
- % of referred friends who become active users
- % of referrals that come from diverse sources (e.g., social media, email, direct link)
- % of referred friends who refer their own friends (secondary referrals)
- % of referred users who convert to premium or paid plans
Analyzing Your PLG Data 👩🔬
To effectively measure and track the success of your PLG strategy, you need the right tools and methodologies for data analysis. The right tool should align with your objectives, and have a customized dashboard to monitor real-time insights. Here are some tools we recommend!
Amplitude: Amplitude helps you figure out what buttons customers are clicking, where they're dropping off, and where they're hooked. It's like having a GPS for user behavior.
Pendo: Pendo lets you create guides and surveys to hear directly from customers in addition to tracking their behavior. It's like having a chat with your users while watching them explore.
Intercom: Intercom helps you track engagement, but it's also a direct line to your users – ask them questions, gather feedback, and make them feel heard.
Google Analytics: With Google Analytics, see where people are coming from and which pages they love.
Data-driven decision-making is key to optimizing your PLG strategy. By relying on empirical evidence rather than assumptions, you can make informed choices that lead to better outcomes and increased growth. The tools listed help you see the stats behind users behavior so your decisions are backed by evidence.
Common Product KPI Challenges & How to Overcome Them 💪
Implementing a robust PLG measurement process comes with its share of challenges. Heres how to address some common problems your business may face when tracking product metrics.
Problem - Your data isn't scaling ⚖️
Solution - As your business grows, your measurement process must scale as well. In fact, a study of over 1,000 companies shows 66% use a 3rd party product analytics tool like Pendo.io, Amplitude, Mixpanel to maintain data hygiene and scale collection processes.
Problem - You’re struggling to manage data collection ✍️
Solution - As you gain more customers collecting and analyzing user data can feel overwhelming. Virtual onboarding tools collect and manage new user data while also helping customers adopt more features and discover value moments - 35% of companies are already doing this with tools like Appcues, Userflow and Driveway.app ;)
Problem - Your users are not activating 🙁
Solution - Market conditions fluctuate, impacting the performance of your PLG strategy. Interactive demo tools like Driveway.app, Navattic, and Reprise help users self-serve and adopt features that show your product’s value.
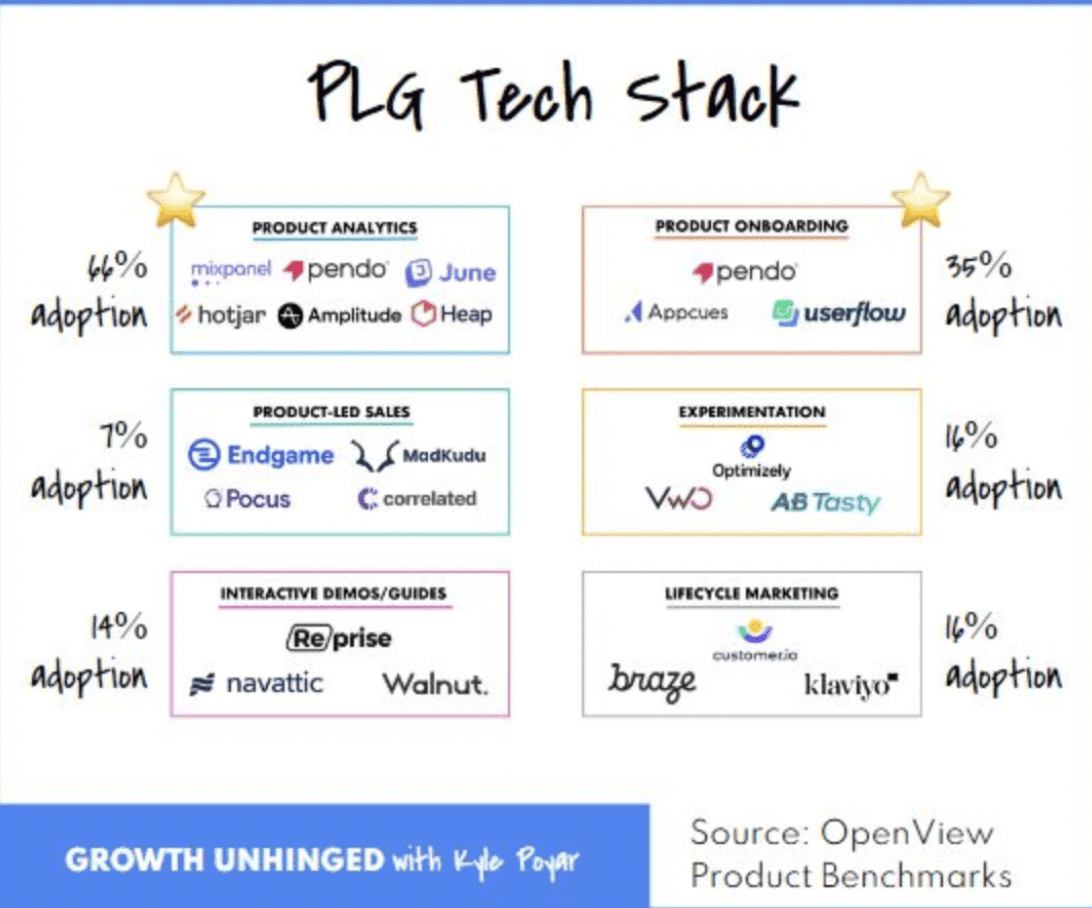
(For more on this, check out this awesome linkedin post by Kyle Poyar)
This is where we leave you ... and your KPIs
Measuring and tracking the success of your Product-Led Growth strategy is vital to sustainable business growth. By focusing on the right metrics and KPIs, analyzing data, and continuously iterating on your approach, you can optimize your PLG strategy for maximum impact.
Embrace a data-driven mindset, and let the insights obtained from tracking your PLG metrics guide your path to success in the ever-evolving business landscape. With a strong PLG strategy and a commitment to data excellence, you can propel your startup to new heights of success and innovation.